The behavior of the ISE-100 exhibits a pretty similar trend to that of the Mexico IPC index following the currency crisis there in the 1980s (see 1980s Mexican Currency Crisis). A BOP/liquidity/financial crisis causes a currency implosion and the index just goes into meltdown and then a period of stasis for a few years before ripping higher once all the bad blood gets flushed through the system courtesy of structural reform and fiscal consolidation.
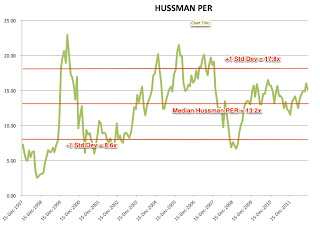
Here are the multiples for the index:
As you can see the market experienced some pretty severe multiple compression in the wake of the financial crisis (not surprisingly) and then basically drifted below 10x peak earnings for a while before re-rating higher. I suspect, this will be a similar tale for most countries that experience a financial crisis: fingers get burnt, investors leave and ignore decent newsflow coming out of the country as the economy gets back on an even keel and then finally a few years later once the slate is wiped clean the market can then re-rate.
The median Hussman PER from 1998-2003 was 7.86x, primarily due to the huge spike in multiples courtesy of the 2000 stabilization program. Buying 1 std dev off this (i.e. at a Hussman PER of 3.0x) would actually not have been possible even in the depths of the crisis as the market got only down to about 6.0x peak earnings, or approximately a 25% discount to median peak earnings. A 30% discount to the median PER would have flagged a buy at around 5.5x earnings.
Assuming one went in at 6.0x earnings in April 2001 and then sold when multiples re-adjusted back up to the median level would have meant selling out the next month! That would have resulted in a 54% gain or so (the market rallied strong) but one would have been crippled by the collapse in FX rates as well.
In fact, buying at a trough on these criteria would have been much apparent during Lehman, which also represented a fantastic buying opportunity, and would have been easier to execute on.
Book value on the other hand was volatile during the crisis. Clearly the market got heavily overvalued on a PB basis in early 2000, but the median PB was 1.9x over 1998-2003 and while one could have bought at -1 std dev of 1.0x or cheaper in October 2001 to sell out again in Jan 2002 for a 78% gain.
If anything, what this shows is the huge volatility in markets in the wake of a proper financial crisis and it is hard to know how to maintain a sell discipline. This is not exactly buy and hold stuff if one is sticking to valuation as a yardstick. I couldn't find a chart for realized volatility on the ISE-100 but here is a chart for realized FX vol and as one would expect realized vol was pretty crazy between late 2000-02.
Clearly one would have made money if one was nimble and disciplined enough to have made these trades on the index but one would then have missed out on the huge rip higher over the coming decade as the market then dramatically rerated after a few years.
If other crises follow this path then it may be worth buying the market in post-crisis indexes at lower discounts to trailing median multiples etc. but this will require more investigation. But so will understanding about sell discipline.
What is interesting though is looking at this chart of inflation, the ISE-100 seems to have really taken off again once inflation had fallen well past the previous trough it reached pre-crisis. The low was hit in February 2001 at 33.4%just as the peg was about to blow, this level was breached once again in November 2002 and continued to decline (there was a slight blip back towards the 30% level in mid-2003) but by end 2003 we were looking at 20% levels and then the market really began to rip.


No comments:
Post a Comment