Monday, October 14, 2013

Russian Equities

"Even after last week’s 2.5 percent rally, Russian equities have the cheapest valuations among 21 emerging economies tracked by Bloomberg. The Micex Index’s 12-month estimated price-to-earnings ratio was at 4.3 today, compared with a multiple of 10.7 for the MSCI Emerging Markets Index."
Berg September 23rd

The Oriental Speculator has been looking around for bargains globally and TBH finds itself hard pressed to get too excited about much. The one market that looks potentially appealing from a valuation perspective is Russia. 

Now there are many good reasons for Russia to trade at a discount to developed markets - see here for an incredible exchange between Russian management and a fund manager working at an overseas shop. Russian demographics are also horrible (and people complain about Japan!), corporate governance is non-existent, the state is run by thugs, they hate paying out dividends and the oil companies are going into slow run-off mode.

But 4.9x times earnings? That's cheaper than Pakistan (8.0x earnings - Pakistan is actually trading at a premium to it's five-year average!) and on par with where Korea traded at during the Asian Financial Crisis. Things may be crappy in Russia but they are not 4.9x earnings miserable, and Russia is far less of a failed state than Pakistan. Moreover, unlike Pakistan going into Lehman (or even now), or Korea going into the Asian Crisis, Russia runs a current account surplus. As discussed in the previous post, Russia is about 30% below it's five-year average book value, its currency looks cheap (see here for one view on why Russia would let its currency appreciate, I am not sure I totally buy the rationale but there is a logic to it) and the country is just very cheap on about every metric. 
Source: Credit Suisse

The OS was also intrigued to hear on a podcast with Mebane Faber (go to around 28 minutes 30 seconds in - skip the first 20 minutes of drivel, and focus on the interview. Some smart points made by Meb and actually the interviewer from time-to-time) that Russian energy companies were among the cheapest sub-segments globally in the equity universe - on par with Greece! Jim Grant was also on CNBC a month and half back fielding the usual repertoire of silly questions from the interviewers, but he touched on the issue of he Russian oil plays.

Reflecting upon this then, it shouldn't be too surprising then that the Russian market itself is dirt cheap as the MSCI Russia index is very commodity-heavy at 64% (basically, energy); then banks at 17% and telcos at 9%.
 

source: MSCI

However, given the lack of Russian language skills (the Oriental Speculator studied - if it could be called that - Russian for one year at high school and was frankly horrible at it) and a detailed understanding of the politico-economic dynamics in Mr. Putin's playground, the Oriental Speculator is a little wary of going for single name picks and is leaning towards the funds route. 

So far, the attention of the OS has been focused on the ETF channel and the MSCI Russia Capped Index ETF options. The MSCI Russia Capped Index is basically the same as the MSCI Russia Index except MSCI try to prevent any one stock becoming disproportionately overweighted in the index make-up. Which in Russia's case is probably quite sensible as Gazprom alone is 23% of the index and Sberbank is 14% (basically, Sberbank IS the financials sector in Russia). 

For the MSCI Capped at construction and at each rebalancing, if the weight of the largest company in the sister MSCI Russia Index is greater than 30%, its weight in the MSCI Capped gets stopped out at 30%. The weight of the remaining Group Entities are then increased in proportion to their weight prior to such capping. The remaining stocks are capped at no more than 20% weighting and so on. So basically, the two largest names in theory will never exceed 50% of the index. Further deats here.

There are, at least, two ETFs out there doing this index:

The Oriental Speculator has after decided the db option is probably the more favorable of the two given it trades in HK and thus does not get hit by capital gains. As far as the OS is aware, this is the only Russian ETF listed in HK (HKEX has a list of the ETFs that trade on the exchange available here.)

Within the framework of the capped index, the db ETF tweaks things a little further, and caps an individual company's weight to 25% and quarterly at 20%. That actually means at present the capped index and db's etf is exactly the same as the normal MSCI Russia index, which itself is basically very similar to the MICEX index (albeit, it appears to be a bit higher beta).

iShares takes a slightly different tack as it then uses a 25/50 strategy on the capped index:
"The MSCI 25/50 Indices take into account the investment limits required of regulated investment companies, or RICs, under the current US Internal Revenue Code. One requirement of a RIC is that at the end of each quarter of its tax year no more than 25% of the value of the RIC's assets may be invested in a single issuer and the sum of the weights of all issuers representing more than 5% of the fund should not exceed 50% of the fund’s total assets."

This - the Oriental Speculator presumes - gives rise to the slightly different constituent weights for the ETFs and thus valuations. For while the 25% rule doesn't appear to be breached in the iShares case, the sum weight of all 5% constituents breaching the 50% mark does appear to be.

Source: iShares

Now, the OS is not sure how iShares actually compute the weightings for the stocks over 5% in the actual underlying, but given the capped index is already messing with the original index then iShares is layering in more voodoo on top; and the OS is not a US citizen so doesn't care about the RIC code, the OS doesn't see the iShares as having a compelling selling point over DB's etf in the composition field. (That having said, OVERALL sector weightings are similar for both, it's just what they've chucked in there to get the weightings is different.)
Source: iShares
Source: Deutsche


An obvious problem though is that the iShares ETF is also SUBSTANTIALLY more expensive than the index - although this is probably be due to iShares favoring growthier shares in its rebalance. Now the below data points are from August 30th but the market has rallied since then so I am guessing the iShares ETF is probably MORE expensive than it was back in late August. (Note also the MSCI Russia is not quite the MICEX but tracks it pretty well, albeit it seems to fall more on the down-legs than the MICEX.)
Source: Deutsche
Source: iShares   

Meanwhile the db ETF/capped index's PE went for 5.1x back on August 30th. So you're getting cheaper and more faithful exposure to the Ruskies via ze Germans. 
Source: CapIQ

Now the one issue that could be a wrinkle, is the db option is a synthetic etf. What is a synthetic etf I hear you ask? Some deats on these here. The issue with synthetics is that you are generating your returns via a swap agreement, and thus are exposed to counter-party risk. 

However, there have been a number of improvements in ensuring that investors are protected from the counter-party blowing up. The principal form being a funded swap model and the Russian Capped appears to be one of these - see page 24 of this Morningstar document. So the OS suspects that this is actually not a huge concern and DB is generally considered too big to fail (although one wonders if things get really sticky would Fraulein Merkel care that much about saving overseas investors in a Russian ETF... probably not).

Thus, out of the ETF names the OS can find that allow one to play Russia, the HK ETF is probably the better option: no CGT, and it represents a more faithful and cheaper way to play in Mr. Putin's playground (assuming one is comfortable with big exposure to commods and banking). Still the OS is gonna take a poke around to see if there are any closed end funds out there trading at interesting discounts.

Monday, August 26, 2013

A more granular look at some of the cheaper countries

Countries that are at a price to book well below their own average typically do better than average going forward.” Steve said. “I’ve found that almost all countries come back within six years, absent confiscation.” A country’s current price to book value relative to its historical average — normalized to adjust for changes in sector mix and political risk over time — became the model’s most heavily weighted factor."


Current Trailing PBR 5-year Average DISCOUNT/PREMIUM
Morocco 2.1 4.3 -51.2%
Peru 2.1 3.7 -43.2%
Czech 1.2 1.9 -36.8%
China  1.4 2 -30.0%
Russia 0.7 1 -30.0%
India 2.3 2.9 -20.7%
Hungary 0.9 1.1 -18.2%
Brazil 1.4 1.7 -17.6%
Chile 1.9 2.3 -17.4%
Korea 1.1 1.3 -15.4%
Egypt 1.5 1.7 -11.8%
Poland 1.3 1.4 -7.1%
Turkey 1.6 1.7 -5.9%
Indonesia 3.5 3.7 -5.4%
Colombia 1.9 1.9 0.0%
Taiwan 1.8 1.8 0.0%
Malaysia 2.2 2.1 4.8%
Mexico 2.9 2.7 7.4%
South Africa 2.5 2.3 8.7%
Thailand 2.3 2 15.0%
Philippines 3.2 2.7 18.5%
Pakistan 2.6 1.9 36.8%
Source: Credit Suisse

Using the Truffle Hound strategy and the Credit Suisse weekly valuations one can see that Russia, China, the Czech Republic, Peru and Morocco are all cheap. More broadly, using earnings and their 5-year average multiple, Taiwan and Korea look cheap as well as Europe (specifically France, Italy, Spain, Norway and Germany).

"mean reversion of even the most undervalued country could be offset by declines in that country’s currency... two factors that worked well and were relatively easy to calculate. The first was a country’s current account balance. “Bad things tend to happen to countries with large current account deficits, and good things tend to happen to countries with large current account surpluses,” he said. The second was its currency’s purchasing power parity (PPP) relative to other currencies... Steve started out by simply using the Big Mac Index to measure a country’s PPP, but he later switched to IMF statistics, adding a linear adjustment for GDP per capita."

Here's the Big Mac Index, with the relevant countries flagged and then a closer look at the trends in PPP over/undervaluation. For the full-blown cool interactive graphics try here


Now I'm unsure what the linear adjustment TH uses to the data to adjust for GDP/capita is - I may try and reverse engineer this at some point. But one can eyeball the countries and offset this in one's head against GDP/capita vs. the US to come up with a crude adjustment

MOROCCO

For some annoying reason, while Morocco does have MacDonald's The Economist doesn't calculate le Big Mac du Maroc's PPP and the Moroccan MaccyD's doesn't say what the effing things cost either!! However, it does look like a Big Mac cost about 47 dirhams back in April 2012 and perhaps as much as 65 dirhams in April 2013, according to Twitter

At the current (as of 12/08/2013) FX rate a $4.56 Big Mac should be 38.2 dirhams. Whichever way you cut it a 47 or 65 dirham Big Mac looks very overvalued, either about 23% or 70%, and this is more problematic when you consider that PPP should in theory understate the value of a lower GDP-capita country due to the non-tradeable goods sector. Indeed back in 2006 - when The Economist actually did put the Moroccans in the index - the Dirham actually seemed reasonably valued/slightly undervalued.


The overvaluation appears to be primarily due to the Moroccans pegging the dirham to a basket of currencies (page four - Natixis does some pretty decent research on Morocco btw). As you can see from the 10-year USDMAD chart the Dirham hasn't really moved over the time frame. My calculation off the Big Mac index implies the currency should be either at 10.31 or even 14.25 to the dollar. Even the lower estimate is way above where the MAD has traded at over the past decade.


Having not looked at their FX reserves I wonder how long the authorities can keep this up for? Moroccan stocks better be cheap to compensate for this, I am tempted to file in the wastepaper bin for now... (on a side note I've always found it puzzling how Arisaig can be comfortable in investing in things like Central Laitiere and Brasseries du Maroc at such high multiples, especially if the macro looks so rickety)


PERU


Peru is slightly harder to pin down, they've clearly been running higher current account deficits since 2006, but this has been offset by brisk economic growth. However, I suspect a fair amount of the growth has been due to it being reasonably levered into the Chinese commodity supercycle, which is probably drawing to a close so there is scope for the current account to deficit to deteriorate as a % of GDP. That having said, the market is clearly cheap, on a PPP-basis the currency looks undervalued (unlike Morocco); and the CA deficit as a % of GDP doesn't appear to be insanely onerous at this point.


CZECH


The Czech Republic is notable for both its undervaluation on a historical PBR  basis (-37%) and the PPP undervaluation against the dollar. They do run a current account deficit, but the thing seems to hauling its ass out of the pit, making successively lower lows (sound like a bit of a chartist there) of late as it trends back to surplus. Indeed, the deficit seems to be reasonably cyclical. Not knowing anything about their economy I wonder if they are continuing to climb out of the current account deficit pit or are about to fall back into it?


RUSSIA


The ruble seems to have been constantly cheap on a PPP basis over the past decade, and seems to be nearer the lower end of its historic PPP-trading band, for what that's worth. Current Account surpluses though have been coming in smaller as a % of GDP for a while, although the actual current account expressed in USD is pretty volatile and seems (to my eyeballs, at least) afflicted by a good deal of seasonality. That having said, they still run a solid current account surplus, have an undervalued currency and their stock market is not just cheap in real terms (i.e., less than book and low single-digit earnings) but also on a relative historical basis.

Here are two interesting pieces on Russia:
1. The market being cheap here at ETF Trends
2. The country being a source of relative calm vs. other GEMs as noted by the FT
“The glory of Russia is that it runs a current account surplus and the fiscal deficit is very low. Moreover, as a result of developments in the Middle East, oil prices are holding up” said Kingsmill Bond, chief strategist at Russian state bank Sberbank’s investment banking arm. “Consequently the rouble is able to avoid the pressures faced by other currencies.”


EUROZONE


The Economist's Big Mac index flags the Euro as at approximately fair value, although it doesn't say what they took as the Eurozone average burger price in their data set. Although it would appear to be the cost of ein Big Mac in Deutschland is EUR3.64.


Thankfully for me Bruegel have a done a lot of the heavy lifting and analysis in  a series of interesting posts here and here. The basic thrust seems to be prices in Italy and France require some adjustment (i.e., the French and Italian Euro/prices are overvalued relative to the rest of the zone). Spain and Greece seem cheap, and Germany fairly valued. 

There seems to be quite a lot happening in the Eurozone so I am going to handle the place in a separate post looking at the current account deficits and try and get some historical data on the PBR discounts there. 

TAIWAN 


Taiwan runs some pretty punchy current account surpluses and has been sporting a very undervalued FX rate for a while too. If anything, it looks to be on a long-term downtrend. On a PBR basis though it looks reasonably valued. 


KOREA


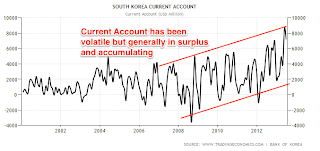
Korea on the other hand, is trading well at the bottom of its five-year PBR band based on GS' kickstart data and it's been running some decent surpluses with a consistently cheap FX rate. This could be quite a promising market.

Tuesday, August 6, 2013

Global Valuations - where to look?

One of the things that GS - to its credit - does well are the weekly kickstart series.
In conjunction with the GMO asset class forecasts I find them a useful way to scan for cheap markets and then from there rummage around for ideas. I've also thrown in the weekly GEM valuations from CS as well as a cross check.

Here's a quick rummage through:
In terms of 12-mo performance LatAm has been a shocker: Brazil, Peru, and Chile all off. (Amusingly, perennial econ basket case Argentina seems to be doing quite well and Peru is expensive on a CAPE basis as Mebane Faber points out.) Elsewhere, in some of the more exotic, off-piste frontier markets we have: Egypt, Jordan and Morocco, plus some Central/Eastern European names like the Czech Republic, all racking up bad numbers. And then finally, the big daddy of the GEMs, China.
Looking at historical valuations we can see China, Taiwan and Korea stand out as cheap in Asia and then looking to the Middle East, Egypt and Morocco are both cheap on a valuation and relative-to-history-basis. Brazil actually doesn't appear so cheap though and then we have markets like perma-cheap Russia and Hungary in Europe. Going back to Asia Hong Kong, China and Korea all look cheap on a historical basis too. Given China is hard to invest in without licenses then the easiest focus is Korea and HK.
Admittedly, Korea is always quite a cheap market and it has also been taking a bit of a downgrade on earnings forecasts, for what it's worth. 

It is interesting, if perhaps unsurprising to also note, that Korea, China and Taiwan are also the biggest underweights among GEM fund managers, according to the following chart from Citi (via BDT Invest).
In Euro-land the whole place looks pretty cheap, especially compared to some of the more hardcore frontier-markets and (in theory) should have less governance issues. Spain and Italy are both available for below book, as interestingly is Norway and neither France nor Germany appear expensive at first glance on an earnings basis.
As for Japan... try as I might, it's a little hard to get super excited. OK so they may or may not get out of deflation, which could tip multiples but the market doesn't look that cheap especially on a historical basis and when compared to the rest of Asia. That's not to say there aren't cheap stocks there but I figure for now there are cheaper and easier places to look. (I.e. Europe, Korea, HK and possibly places like Brazil, Taiwan, Morocco, and parts of Eastern Europe)


Looking at the latest GMO seven-year forecast we can see mavens from Boston are quite optimistic about the prospects for emerging market equities. I am not quite sure how they define emerging market but it is noteworthy the level of returns they are forecasting for the asset class. I would also note that The Economist ran a fairly bearish cover on the GEM space only a few weeks back, which I believe is quite a good contrarian signal.

(As smart as the chaps at The Economist are - I have a few friends writing for them and even toyed with the idea of writing for them at one point, hell, to it's credit it is pretty much the only news weekly left! - they remain a weekly magazine and getting stuff onto the front cover takes time hence it remains in my book a contrarian signal. If you need confirmation look at this cover from March 1999, which was published just as crude went parabolic.)

So in conclusion, I am tempted by the valuations in Europe (specifically France, Italy, Spain, Norway and Germany), Korea, and HK; possibly Taiwan and casting the net a little further afield potentially Brazil and Morocco. Obviously, this is a starting point so the trick from here is to look at current accounts, credit growth etc. in these markets.

Oh a prettier way to look at this all may be Damodaran's heat map, although TBH I am a little surprised at the multiples being thrown off by it. Oh well at least it look's pretty and it does also suggest Korea, China and Taiwan are cheap but little surprised with some of the reads in Europe and Brazil. Also is Nigeria that cheap?

Tuesday, February 5, 2013

Calafia Beach Pundit On Argentina

Brilliant post at Calafia Beach Pundit on economic crimes recidivist Argentina and their current attempts to fiddle CPI (for which they are on track to get thrown out of the IMF for, if they are not careful) and price controls.

"The chart above shows the allegedly manipulated CPI statistics. Note how year over year inflation has been suspiciously flat around 10% per year since early 2007, when the government puts its own man in charge of the statistics office. For the past 36 months, year over year inflation has been almost exactly 10% every single month—something that is nearly impossible in the real world.

The chart above almost surely does not show manipulated data for currency in circulation. For the past 36 months currency in circulation has grown almost 40% per year. It is virtually impossible for currency to grow 40% a year at the same time inflation is only 10% per year. The M2 measure of Argentina's money supply is also growing at breakneck speed, averaging about 32% a year for the past three years. The growth of currency and M2 points strongly to inflation being 25-30% per year, as most independent economists suggest it is."

Monday, February 4, 2013

LATVIAN CRISIS 2008

OK so by now the story of currency crises is beginning to run a reasonably familiar path: 
  • Large current account deficits (i.e. above 5% of GDP) 
  • Foreign capital portfolio inflows
  • Domestic consumption and real estate booms fuelled by cheap and easy access to debt
  • Usually some kind of currency peg or favourable carry conditions with a large degree of risk concentrated in the banking/financial system due to maturity/FX/concentration mismatches.
And Latvia was no different - the country pretty much ticks all the boxes above.
In the noughties Latvia was racking up high single digit/low double digit GDP growth rates. The country had fixed its exchange rate to the euro and allowed free capital movement. Interest rates were determined by the eurozone, which meant its real interest rate was negative and hiking rates (with no capital controls) would probably have only fuelled capital inflows in search of positive carry (a la Iceland).
Short-term capital inflows came largely from foreign (mainly Swedish) banks, which owned about 2/3 of the banking system. This led to a large ramp up in money supply, increased inflation, rapid credit growth and a consumption and real estate boom due to easy credit conditions.
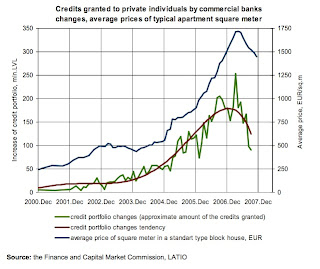
The boom in lending is best seen in the supercharged rise in total banking system assets - between Jan 2002- Jan 2008 the smallest YoY growth on a monthly basis in the Latvian banking system's total assets was 20%, most months it was growing @ c.35% and it hit 47% one month!
Expansionary bank lending stimulated mortgage growth, which grossly inflated real estate prices, both at the residential and commercial level.


The fixed exchange rate and lack of productivity growth raised production costs and priced the Baltic countries out of export markets, especially as neighboring Russia, Sweden, and Poland let their currencies depreciate. Fold in the ramp up in real estate prices and the influx of foreign capital and inflation began to run rampant, picking up aggressively going into 2008.

Latvia managed also to run a huge current account deficit off the back of all of this: at its peak this was around 23% of GDP. Unsurprisingly, imports were booming and saving rates were persistently negative over the period.

 
BTW the bulls (ahem... sell-siders) argued the current account deficit was OK because a large chunk of it was financed by long-term FDI.... actually about 8-9% was long-term FDI which still left about 15% funded by hot money!? This was mainly from foreign banks - primarily Swedish lenders who owned most of the local banking system.
"banks in current account deficit countries are generally reliant on wholesale funding. [It’s the crisis in wholesale funding that is causing the problems in American banks now.]... When a country has a fixed exchange rate that is too high (evidenced by unsustainable current account deficits) they become subject to runs on the currency... Some speculator... shorts-sells the currency and buys whatever it is fixed to... they reduce domestic money supply causing short term interest rates to rise. If they do this enough they induce a recession (ugly). This creates pressure (political and otherwise) for a deviation.
· Alternatively the central banks sterilises the money supply change. However if they continue to do this they will run out of foreign currency reserves – and the fixed exchange rate collapses anyway.
Many a fixed currency has been broken this way... a currency run results in the banks being de-funded...  you need to be really careful of countries with fixed exchange rates and huge, unsustainable current account deficits.

Never much fun shorting the banks in such countries
If you had picked the collapse of the Thai Banks you might have cleverly shorted the stocks. It would not have helped much. Suppose you shorted $100 worth of a Thai bank. It collapsed down 95%... The only problem is that you have the profit in the pre-crisis exchange rate. The currency also dropped almost 90%. So you were left with about $10 profit. That is fine-and-dandy but it is not much reward for effort of picking a system that is about to collapse.
You would of course be much better just shorting the currency – or shorting the ADRs of the target stock (the ADRs being priced in a hard currency).
The real exception is that if you find a bank in a hard currency that is totally exposed to the debacle country you can make a fortune... Swedbank is my bank. It is not the only one – but is very spectacular."


THE CRISIS


Anyway, along came Lehman, everyone freaked out and realised the situation was unsustainable. The country got an EU/IMF bailout of EUR7.5bn in December 2008. The bailout forced the country to hike sales tax (i.e. fiscal consolidation in the jargon), cut public sector wages and spending and cut the budget deficit (all very Indonesia 1998!) but it allowed the country to keep its euro peg! (The IMF was actually proposing Latvia abandon the peg but there was heavy commitment to it domestically.)

So instead of the depeg and ensuing inflation, spike in bankruptcies and banks going insolvent etc. followed by a rapid equalisation of the current account led by exports the Latvians decided to go for internal devaluation in response to the crisis (i.e. lower unit labor costs by cutting wages).


WHAT EXTERNAL DEVALUATION WOULD HAVE GOT

Given how absurd the current account deficit was, a devaluation would have been sharp if it occurred. Olivier Blanchard of the IMF estimated it would have been in the region of 50% (given how imbalanced things were this sounds reasonable, the ISK troughed at 40% of its pre-crisis levels). That would imply foreign debt doubling to around 270% of GDP and given how few payments are actually even made in lats in Latvia, it would have required a huge recap of the banking system following a wave of NPLs (primarily in euro-denominated mortgages). However, Latvia would then most likely have followed the path of most currency crises based on unsustainable pegs: 
  • Spike in interest rates that then start easing a quarter after the depeg
  • Spike in inflation that peaks roughly 6-months after the event
  • Bankruptcy and recapitalization of the banking system due to NPLs resulting from FX mismatches and higher rates
  • Spike in corporate bankruptcies and mortgage defaults, usually this is quick as all/most of the leveraged entities get wiped out within a few months though their can be a 2nd spike a year later
  • a mid to high single digit contraction in GDP, which then troughs roughly four quarters (i.e. a year) after the depeg (partially due to YoY effects)
  • Automatic improvement in the current account due to a collapse in imports and then a rebound in exports
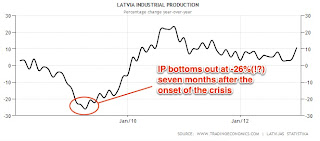
  • Industrial production bottoming out about six/seven months from the depeg (yep, this happened but the implosion was horrific)

WHAT INTERNAL DEVALUATION GOT

The reforms sliced the number of government ministries by 30% and the no. of state agencies, closing approx. 100 schools and shutting 60% of hospitals (to 24 from 59) and slashing public sector wages. Just think about the schools and hospitals element for a moment... now I know nothing about healthcare or education in Latvia but this seems a very, very aggressive strategy.


Inflation in Q4 2009 dropped to -4.2% in Q1 2010 but had risen to 5% by mid-2011, which lowered real interest rates significantly.  


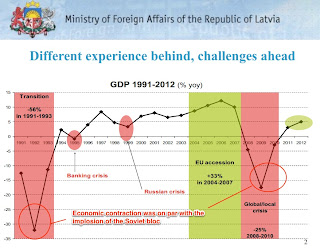
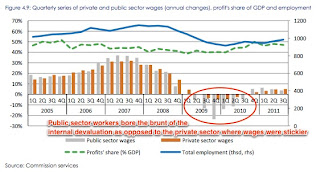
The central plank of the internal devaluation was a 26% cut in public sector wages. The misery wrought - i.e. a contraction in the ballpark experienced when the USSR collapsed - and the amount of time it took to recover vs. the other Baltics show how painful the internal devaluation route was (not to say external devaluation would have been painless either but... )

From peak to trough, Latvian GDP collapsed by 25%, which is about 2x as in Iceland and Ireland, even though in all three countries output fell back to its early 2005 level. Iceland had much higher gross and also net foreign liabilities than Latvia thus the actual debt burden shock in Iceland was much higher than what Latvia would have suffered with exchange-rate devaluation. Iceland's banking sector suffered meltdown and foreign lenders to banks suffered massive losses. Yet the crisis impact was much more benign in Iceland than Latvia (as measured by GDP contraction, unemployment etc.)

More importantly, countries that witness large, crisis-driven devaluations usually also post GDP considerably above their predevaluation level of GDP three years later. The average economy is up by 6.5% over their predevaluation level of GDP. Latvia, by contrast, was down 21.3% of GDP, three years after the crisis began.
Proponents of the peg point out that Barbados, Slovakia, and Denmark all demonstrated a peg can enforce economic discipline and facilitate structural reforms whereas  a devaluation brings fast cost relief, but many countries end up in a vicious inflation-and-devaluation circle. A spirited defence of not devaluing the currency by the Gov of Barbados' central bank can be found here btw (Barbados, similar to Latvia, ignored IMF advice and went for internal devaluation of 9% of public sector wages rather than depegging back in 1991 after running large current account deficits while pegging their currency to the USD). Although the argument here seems to be more focused on the size of the economy rather than structural reforms per se.

(It's also worth flagging that a peg in itself is not needed to create a currency crisis - Iceland managed to sink the krona quite effectively by going all out on carry trading, and amassing a huge FX liabilities mismatch with overseas-denominated debts that it was incapable of paying without continued negative carry for ISK-based debtors.)


BANKING SYSTEM

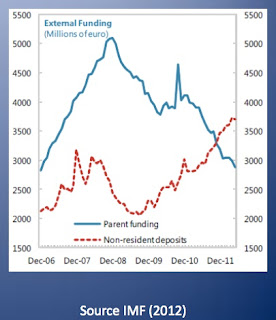
The actual cost to the Latvian govt of recapping the banking system was/is pretty small as 2/3 of the banking system is owned by Scandinavian lenders and the parents assumed the writedowns and supported their Latvian subs making the Latvian Central Bank and by extension the govt less relevant as lender-of-last-resort. 

Clearly, a lot of loans were underwater post-Lehman given the property market collapsed but the decision to keep the peg also meant that NPLs rose gradually as opposed to experiencing a massive spike and killing off insolvent borrowers (see table above) and that banks didn't suddenly become insolvent overnight. (87% of Latvian loans are made in euros.)

Among domestically owned lenders only Parex Bank was nationalised - owners Valery Kargins and Viktor Krasovickis allegedly also had ties to Russian organized crime. Parex only had a 14% market share though, so the risk wasn't systemic and Latvia didn't take on an Ireland-style liability in guaranteeing/bailing out its banks.


The Swedish central bank also offered a euro/lats swap to Latvia and the ECB agreed with the Swedish central bank a Swedish krona/euro swap, thus supplying ample FX liquidity (indirectly) to maintain the peg. 

According to the ECB, the loss incurred by foreign banks was about 5.7% of GDP and the loss of domestic banks about 3.6% of GDP by 2010. Punchy, but not something like Japan experienced in the late 1990s etc or Iceland for that matter. Bank support boosted the public debt/GDP ratio by about 7 percentage points of GDP by 2010. Banks have been deleveraging  since November 2008 when total assets in the banking system peaked out at 23.4bn Lats and as of Nov 2012 total assets were 20bn lats (i.e., down 14.5% from the peak). However, external debt still stands at elevated levels (forecast above 130% of GDP  for 2012).  


CURRENT ACCOUNT SURPLUS/TRADE BALANCE

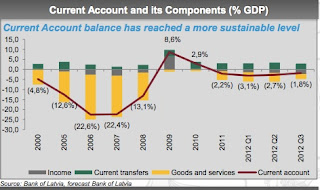
Unsurprisingly, import demand collapsed in 2009 which sliced the CA deficit in 1/2 and then pushed the country back into surplus by 2010. The CA moved back into negative territory in 2011, reflecting increased import demand on the back of an economic recovery. The deficit though is pretty modest and external financing requirements have declined from almost 500% of FX reserves in 2008. Currently, Latvia’s international reserves are about $5.5 billion, almost equaling both the $1.65 billion of lats in circulation and total bank deposits in lat of $4.2 billion, which should be enough to guarantee stability.

Manufacturing, which exports almost two-thirds of its output, performed well. The initial markets were Latvia's traditional trade partners (the Nordic and Baltic countries, Russia, and Poland, these accounted for 72% of Latvia's exports of goods in 2011) but by 2011 Latvian exporters were also expanding into other destinations and propelled most of the export growth (albeit at lower YoY rates). Admittedly, some of this is due to re-exportation and/or refining of petroleum-based products.

UNEMPLOYMENT


The internal devaluation's purpose was to bring unit labor costs down and on par with competitors and in line with productivity gains. Thus from 2000 to 2004 Latvian living standards were rising, but were rising in line with productivity and thus ULC rises were sustainable. From 2005 onwards the link was broken, and wages went ballistic. During 2008 and 2009 ULCs started to improve (partly because many unproductive workers in construction lost their jobs) and have converged with productivity gains once more.
The spike in unemployment and lower wages put pressure on private sector wages to adjust, which is more relevant for competitiveness. Quite how much these have adjusted is debatable but what is acknowledged is that it is nowhere like what the public sector felt. 

Nominal wages have started rising again, however, there probably is substantial room for productivity increases given income per capita is half the EU average and it's exports are not particularly high-tech nor for that matter is the country.

Unemployment remains high at 13.5% versus pre-crisis levels (6-8%), although it has declined significantly from its peak.

CONSUMPTION


GOVERNMENT FINANCES


Latvian fiscal policy was actually pretty prudent up until the crisis (shame about the monetary policy): the country pretty much ran a balanced budget. Public debt was very low pre-crisis - low double to high single digits as a % of GDP. Even today, public debt remains around 40% of GDP and is expected to stabilize at around 45% of GDP. This more or less eliminated sovereign default concerns (also Latvia as mentioned was not on the hook for its banking system).
Latvia successfully completed its IMF/EU programme in 2011 without asking for a follow-up agreement and  returned to international bond markets in 2011 (low debt to GDP helped, although its worth noting that even recidivists like Argentina were able to return to the debt markets after their default). 
The crisis caused  a large budget deficit, as it undermined state revenues and boosted social expenditures.
However, the 2011 fiscal deficit was reduced to below the official target of 4.5% of GDP and the government intends to bring it to 2.5% to meet the Maastricht criterion. (Also it is worth noting the insane cutbacks to the public sector also help the fiscal position as the country rebounds.)

MY THOUGHTS:

I am inclined to agree with Krugman on this one.
"Latvia’s willingness to endure extreme austerity is politically impressive, its economic data don’t support any of the claims being made about its economic lessons"

The country would have been better off pulling an Iceland if it wanted a speedy, less painful recovery. On the other hand if it is dying to get into the Euro then it has sure proved itself!